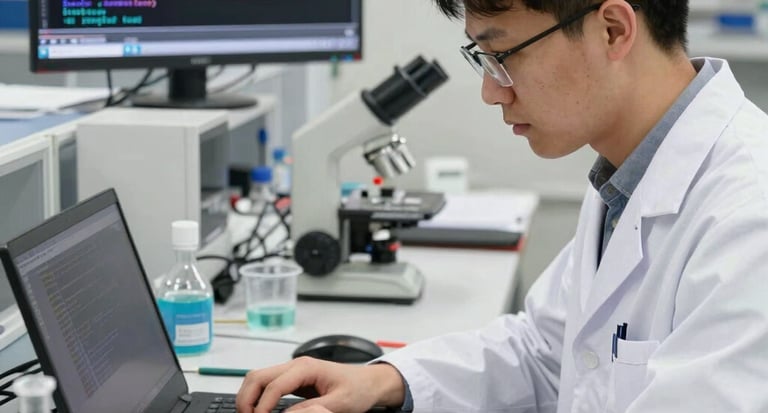
R for Biologists (Online Hands-on Training)
A hands-on program to master R programming for biological data analysis and visualization. This course equips participants with essential R skills, enabling them to analyze, manipulate, and visualize real-world biological datasets with confidence.
24 - 28 JULY 2026 | 7:15 PM IST | ONLINE
From 24 to 28 July 2026 | 7:15 PM IST | Online| Certificate
About the Training
This online hands-on training introduces participants to R programming, starting from basics to advanced data visualization and statistical analysis. The course focuses on real-world biological datasets, helping learners build practical skills for research, data analysis, and publication-quality visualizations.
What You Will Learn
Fundamentals of R and RStudio environment
Data structures (vectors, matrices, data frames)
Data import, export, and preprocessing
Data manipulation using dplyr
Data visualization using ggplot2
Statistical analysis (t-test, ANOVA, regression)
Heatmaps and clustering techniques
Creating publication-quality plots
Course Features
Live hands-on sessions
e-Certificate upon completion
Session recordings for revision
Lecture PPTs and study materials
Real-world biological datasets for practice
Learning Outcomes
Perform data analysis using R programming
Manipulate and clean biological datasets
Create advanced visualizations and plots
Apply statistical methods to experimental data
Generate publication-ready figures
Who Can Join
Undergraduate and postgraduate students in Life Sciences
Research scholars and faculty members
Professionals from Biotechnology, Biochemistry, Microbiology, and related domains
Medical, Pharmacy, and Chemical Sciences background participants
Course Fee
Indian Participants: ₹1299 INR
International Participants: 85 USD
Course Module
Day 1: Introduction to R and Basic Programming
Introduction to R and RStudio
Installing R & RStudio
Understanding the R interface
Running basic commands
Variables, lists, vectors, matrices, data frames
Operators and calculations
Indexing and subsetting data
Importing and exporting data (read.csv, read.table)
Hands-on: Manipulate biological datasets
Day 2: Data Manipulation with dplyr
filter(), select(), mutate(), arrange(), summarize()
Combining commands with pipes (%>%)
Transforming datasets and creating variables
Reshaping and organizing data
Hands-on: Clean and organize biological data
Day 3: Data Visualization with ggplot2
Aesthetic mappings & geoms
Scatter, bar, box plots
Themes, labels, colors
Regression lines and faceting
Hands-on: Create and customize biological visualizations
Day 4: Statistical Analysis in R
t-tests, ANOVA
Statistical workflows
Adding p-values to plots
Correlation & linear regression
Hands-on: Apply statistical analysis to gene expression data
Day 5: Advanced Visualization & Heatmaps
Heatmap creation (pheatmap, ComplexHeatmap)
Clustering and large dataset visualization
Multi-panel and complex plots
Hands-on: Build advanced visualizations